Essay · July 2026
Dataqualityisthethirdaxis
Every spreadsheet displays its numbers with identical confidence. That's the lie. Trust in a number isn't binary — it's graded, and it's a dimension we've simply never rendered.
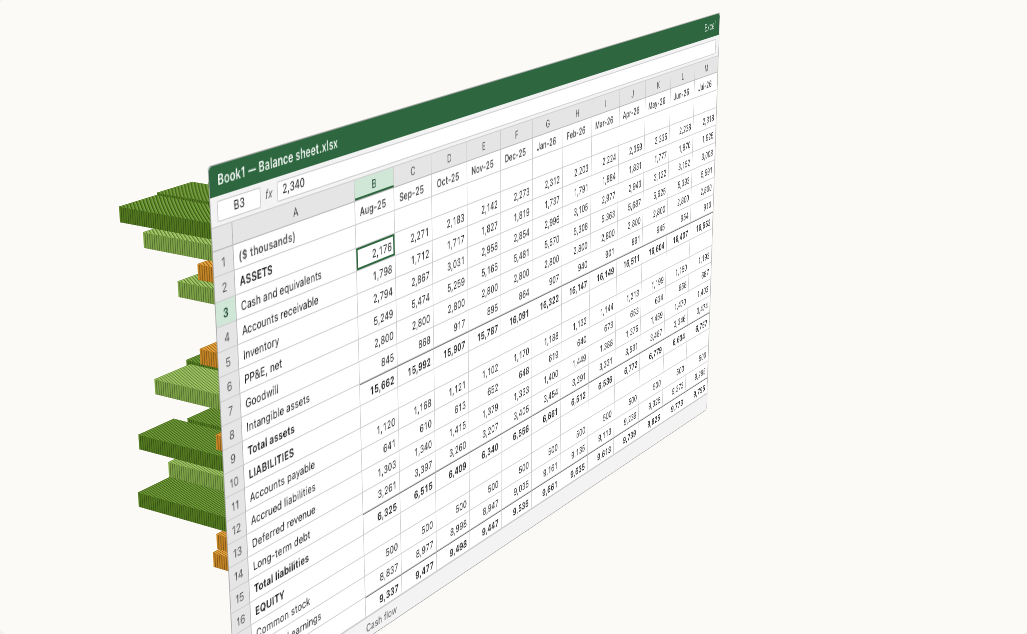
A balance sheet is a flat object. Two axes: rows for what a thing is, columns for when. Every cell gets the same treatment — same font, same weight, same typographic certainty. The $2,340,000 of cash that ties to a bank statement looks exactly like the $2,800,000 of goodwill that hasn't been seriously tested since the acquisition. The grid format itself launders uncertainty.
And because the interface offers no way to express partial confidence, people default to treating trust as binary. You either accept the sheet or you audit the sheet. There is no affordance for "I trust this cell at sixty percent." Yet anyone who has ever closed a set of books knows the truth: the trust profile of a financial statement is lumpy. Cash is granite. Accrued liabilities are clay. Goodwill is often weather.
I think the fix is architectural. Quality isn't a footnote. It's a third axis — a dimension of the spreadsheet that has always existed and has never been drawn. A color flag or an audit badge is an honest projection of that axis onto the flat grid; the point is that quality is first-class data, however you draw it.
So I drew it. The workbook below looks like any twelve-month balance sheet. Grab it and turn it around.
One block, one quality point. A perfect cell is a hundred-block green column; the color of each stack follows its score. Blank cells stay flat.
Whattheterraintellsyou
Two patterns emerge the moment the board comes into view, and they run in different directions.
The first runs east–west. Goodwill and intangibles form a low red canyon across all twelve months, while cash and long-term debt stand as tall green ridges. This is structural quality: some numbers are weak by nature of how they're produced, and time alone doesn't fix them. They were estimates the day they were booked and they're estimates today.
The second runs north–south, along the time axis. Watch the right edge of the board — the most recent months — visibly erode. Those periods aren't closed. Accruals aren't booked, reconciliations aren't done, nobody has signed off. This is temporal quality: this month's balance sheet is literally a lower-grade object than last quarter's, and it firms up block by block as the close process runs. Every controller knows this in their bones. No spreadsheet has ever shown it.
Notice, too, what happens to the totals. Each total row inherits the quality of its components — value-weighted in this demo, though a weakest-link rule is just as defensible — so "Total assets" can look authoritative on the front of the sheet while quietly carrying the weakness of its softest inputs on the back. Aggregation doesn't create trust. It averages it.
Two kinds of weak
Structural weakness runs east–west: goodwill was an estimate the day it was booked, and time does not fix it. Temporal weakness runs north–south: the newest months are low-grade until the close process firms them up, block by block.
Whatearnsablock
For the demo, scores are illustrative. In production, a block should be earned — by verifiable properties of the cell's provenance: does it tie to a system of record, has it been reconciled, is it an actual or an estimate, how stale is the source, has a human signed off. Five criteria, twenty points each, is enough to be legible; the specific rubric matters less than the discipline of having one. The moment quality is scored rather than felt, it can be tracked, trended, and argued about — which is exactly what you want.
I've built a version of this before. At Strata Decision Technology I worked on data quality algorithms for a patient data integrity product, scoring patient data before anyone downstream acted on it. Same argument, different grid.
Everynumberhasthisaxis
None of this is unique to accounting. Every number you have ever been shown — a KPI on a dashboard, a market size in a pitch deck, a figure in a news chart — arrived making the same silent claim: I am correct. Nobody grants a number that status on purpose. It happens because the screen gives you nothing else to go on. If it's displayed, it must be right. Some tools already carry source tags and audit marks; the default grid culture doesn't.
Some of those numbers were measured. Some were modeled. Some were a guess made the night before the meeting, formatted in the same font as the facts.
Science settled this long ago: a measurement without error bars doesn't count. The rest of us dropped the error bars somewhere between the lab and the dashboard. A value is one axis of a piece of data. How much you can trust it is another. How fresh it is, another still. We render the first axis and throw the rest away — then act surprised when a projection gets treated like a fact.
Finance happens to be where this is easiest to fix, because finance already has the checking machinery: bank statements, reconciliations, sign-offs. That's why the demo above is a balance sheet. But the third axis belongs to every grid of numbers you have ever trusted.
Whatateamcanactuallydo
Start smaller than you think: pick one report and score it. The rubric from earlier — does it tie to a system of record, has it been reconciled, is it an actual or an estimate, how stale is it, has anyone signed off — is five questions per number. A person could score a balance sheet by hand in an afternoon. Once.
That's where AI changes the economics. The checks are mechanical: match this cell against the bank feed, find the journal entry behind it, confirm the reconciliation ran, notice that nobody has counted inventory since October. An agent can run those checks on every cell, every day, and keep every score current. Humans still set the rubric and still do the sign-offs. The machine just refuses to forget which numbers passed.
When does this matter enough to build? Three situations. When numbers leave the building — a board pack, a lender package, a diligence data room — and the reader can't see your close process. When the reader can't ask questions — dashboards, and now AI agents, take numbers as given, with no one in the room to say which ones to lean on. And when decisions run automatically: the moment a number feeds something that acts on it, quality stops being a footnote and becomes a control.
Whythismattersmorenow
For as long as humans were the only readers of financial statements, graded trust could live in people's heads. The controller knew which cells were soft. The auditor sampled accordingly. The dimension existed; it was just carried in wetware.
That era is ending. AI agents are starting to consume financial data directly — pulling trial balances, computing ratios, drafting commentary, making decisions. An agent reading a flat spreadsheet inherits the flat lie: every number arrives with implicit certainty of one. If we're going to let machines reason over our books, the trust gradient has to move out of people's heads and into the data itself, as a machine-readable axis riding alongside every value.
This is a specific case of something I've argued for years: the bottleneck to useful machine intelligence isn't raw capability, it's governance — knowing what a system may rely on, and how much. A quality axis on financial data is governance made visible. It's the difference between an agent that says "current ratio is 1.8" and one that says "current ratio is 1.8, resting substantially on an inventory figure nobody has counted since October."
The numbers were never the whole story. The third axis was always there. We just never turned the sheet around.
The flat lie
An agent reading a flat spreadsheet inherits every number at an implicit certainty of one. If machines are going to reason over the books, the trust gradient has to ride alongside the values — scored, machine-readable, per cell.